Research report
What the tariffs are doing to Canadian manufacturers
- Updated August 25, 2026
- 554 classifications
- Sources at the foot of the page
Two in five Canadian exporters make something on the tariff list
The Canadian Federation of Independent Business surveyed 1,833 owners in the first week of August. Among those who export, 40% have products covered by the new United States measures. Of that group, 77% expect to lose revenue this year and 35% expect to lose at least half of it.
- of exporters have covered products
- 40%
- of those expect to lose revenue
- 77%
- expect to lose half or more
- 35%
Canadian Federation of Independent Business, 1,833 business owners, 28 July to 6 August 2026.
In a KPMG survey of 275 Canadian manufacturers, 96% of exporters believed their goods were exempt because they are CUSMA compliant. Section 338 changed that. A valid certificate of origin does not exempt a good that appears on the list.
The three proclamations name 554 classifications between them. Checking whether yours is one of them takes about a minute.
The list
Find out whether the tariffs apply to you
A 50% duty now covers 554 product classifications. Search your product or your HTS code.
Or browse by sector
Scope and limitations
This checks your product against the three tariff proclamations of July 20, 2026, as published in U.S. Note 51 to Subchapter III of Chapter 99 of the Harmonized Tariff Schedule. It is a lookup, not customs advice. Classification is the importer's responsibility, so confirm any result with your customs broker before you act on it.
Applies even to CUSMA-compliant goods.
The rules have changed 48 times in 20 months
- Context
- Before January 2025, no United States tariff measure was aimed at Canada. Since then a new measure has arrived every month, and there has been no pause.
- Impact
- The median gap between one change and the next is 11 days. Eighty-five percent of those gaps are shorter than the 30 days a quote normally stays valid.
- What it means for you
- You quote a job at today's duty rate. If the rate changes before the customer signs, you are committed to a price that no longer covers your cost. No end date has been announced, so waiting for the rules to settle means waiting an unknown number of quarters.
- rule changes since January 2025
- 48
- days between changes, median
- 11
- of gaps shorter than 30 days
- 85%
| Month | Measures |
|---|---|
| 2024-08 | 0 |
| 2024-09 | 0 |
| 2024-10 | 0 |
| 2024-11 | 0 |
| 2024-12 | 0 |
| 2025-01 | 1 |
| 2025-02 | 4 |
| 2025-03 | 6 |
| 2025-04 | 8 |
| 2025-05 | 1 |
| 2025-06 | 3 |
| 2025-07 | 1 |
| 2025-08 | 5 |
| 2025-09 | 1 |
| 2025-10 | 2 |
| 2025-11 | 1 |
| 2025-12 | 3 |
| 2026-01 | 0 |
| 2026-02 | 2 |
| 2026-03 | 0 |
| 2026-04 | 2 |
| 2026-05 | 0 |
| 2026-06 | 3 |
| 2026-07 | 2 |
| 2026-08 | 3 |
The changes come in bursts rather than at a steady rate, and the run of quiet months before January 2025 has not returned.
Source: Blake, Cassels & Graydon LLP tariff timeline, August 7, 2026; Office of the Prime Minister of Canada; CFIB; CNBC and CNN reporting, August 18, 2026.
The sectors hit first are already short of work
- Context
- Wood product manufacturing carries 69 classifications on the tariff list, more than any other sector. That makes it the first place the effect appears in published data.
- Impact
- Between the first quarter of 2025 and the first quarter of 2026, its new orders fell 12.4%, shipments fell 10.5%, and the order backlog fell 6.1%. New orders drop first. Shipments follow as the plant works through what it already won. The backlog is the last thing to shrink.
- What it means for you
- If your deals take six to nine months to close, buyers are already choosing who to invite for the work you would have quoted next spring.
| Measure | Q1 2025 | Q1 2026 | Change |
|---|---|---|---|
| New orders | $2.86B | $2.51B | -12.4% |
| Shipments | $2.77B | $2.48B | -10.5% |
| Unfilled orders | $1.31B | $1.23B | -6.1% |
New orders fell the most and the backlog the least, which is the order a slowdown moves through a manufacturer.
Statistics Canada, other wood product manufacturing, unadjusted. First quarter 2025: shipments $2.77B, new orders $2.86B, unfilled orders $1.31B. Each measure set to 100 at the first quarter of 2025.
A customer's decision to postpone takes about a year to reach a supplier's revenue, and nothing changes in the supplier's own numbers for the first two quarters.
A full order book today is positive. But you need a plan for next month, next quarter, and next year.
- Context
- Unfilled orders across Canadian manufacturing are at their highest level in three and a half years. That looks like strength until you see which sector produced it.
- Impact
- Aerospace accounts for almost all of the rise, up 24.2% since December 2025. Fabricated metal is down 1.9% over the same months and wood product is down 12.0%. Fifty-seven percent of Canadian manufacturers have already paused, reduced or cancelled capital projects.
- What it means for you
- Each postponed project reaches its suppliers about three quarters later, as a quote that never arrives. If your product is on the list and your orders still look normal, the same decline has most likely started for you. It has not reached your order book yet.
- Total manufacturing
- +24.8
- Aerospace
- +34.9
- Fabricated metal
- +13.3
- Wood product
- -14.2
Change in index points between January 2023 and June 2026. Statistics Canada, Table 16-10-0047, unfilled orders, seasonally adjusted.
| Month | Total manufacturing | Aerospace | Fabricated metal | Wood product |
|---|---|---|---|---|
| 2023-01 | 100 | 100 | 100 | 100 |
| 2023-02 | 101.13 | 102.16 | 99.99 | 95.81 |
| 2023-03 | 100.06 | 101.55 | 95.17 | 91.3 |
| 2023-04 | 100.03 | 101.7 | 94.14 | 87.4 |
| 2023-05 | 99.13 | 99.98 | 94.94 | 82.01 |
| 2023-06 | 99.86 | 100.24 | 95.14 | 81.63 |
| 2023-07 | 99.74 | 100.51 | 96.33 | 82.51 |
| 2023-08 | 100.49 | 102.84 | 95.54 | 82.19 |
| 2023-09 | 99.41 | 102.18 | 94.3 | 82.6 |
| 2023-10 | 99.26 | 103.71 | 91.92 | 80.51 |
| 2023-11 | 98.22 | 101.59 | 91.41 | 78.23 |
| 2023-12 | 98.95 | 103.44 | 90 | 77 |
| 2024-01 | 98.93 | 103.17 | 91.33 | 72.23 |
| 2024-02 | 99.78 | 104.15 | 90.88 | 72.42 |
| 2024-03 | 98.26 | 104.13 | 92.12 | 73.12 |
| 2024-04 | 99.16 | 106.42 | 86.69 | 71.2 |
| 2024-05 | 100.26 | 105.73 | 89.95 | 77 |
| 2024-06 | 99.74 | 104.63 | 91.04 | 74.8 |
| 2024-07 | 99.78 | 104.71 | 88.38 | 76.12 |
| 2024-08 | 99.22 | 102.38 | 94.15 | 77.25 |
| 2024-09 | 100.25 | 100.82 | 92.25 | 74.82 |
| 2024-10 | 100.25 | 101.95 | 93.04 | 78.34 |
| 2024-11 | 101.09 | 101.13 | 95.23 | 76.15 |
| 2024-12 | 102.55 | 102.74 | 96.85 | 80.53 |
| 2025-01 | 103.86 | 105.39 | 99.1 | 93.43 |
| 2025-02 | 103.29 | 104.36 | 99.31 | 88.21 |
| 2025-03 | 105.84 | 102.67 | 97.6 | 86.66 |
| 2025-04 | 104.58 | 100.33 | 104.64 | 91.61 |
| 2025-05 | 104.21 | 98.22 | 106.59 | 88.51 |
| 2025-06 | 106.92 | 104.18 | 102.54 | 86.53 |
| 2025-07 | 107.32 | 105.56 | 101.38 | 91.92 |
| 2025-08 | 108.57 | 106.41 | 102.95 | 89.57 |
| 2025-09 | 107.6 | 106.56 | 100.63 | 97.4 |
| 2025-10 | 109.15 | 108.36 | 108.66 | 98.08 |
| 2025-11 | 110.43 | 108.16 | 110.88 | 106.32 |
| 2025-12 | 111.32 | 108.58 | 115.55 | 97.49 |
| 2026-01 | 110.66 | 108.39 | 110.4 | 95.39 |
| 2026-02 | 112.35 | 110.98 | 110.26 | 87.97 |
| 2026-03 | 115.09 | 117.79 | 112.13 | 89.87 |
| 2026-04 | 116.14 | 116.59 | 110.15 | 87.18 |
| 2026-05 | 123.29 | 131.77 | 110.6 | 84.33 |
| 2026-06 | 124.78 | 134.88 | 113.32 | 85.78 |
Aerospace separates from the national total after December 2025 while fabricated metal and wood product fall below it.
Source: Statistics Canada, Table 16-10-0047, unfilled orders, seasonally adjusted. Indexed to January 2023.
The importance of getting on new buyers' radar
- Context
- 6sense surveyed 4,510 business buyers in 2025. A buying group evaluates about five suppliers, four of them named on the first day, and the supplier that won the business was on that first-day list 95% of the time.
- Impact
- The group already knows three quarters of the names it writes down, so roughly one position per opportunity is open to a supplier they have never worked with. By the time a technical buyer makes contact, 62% of the evaluation is finished, and when two suppliers are technically comparable 70% go with the one they have heard of.
- What it means for you
- In a market you have not sold into, you have no referrals and no trade show history, so search results and AI answers are the only places a buyer can find you and judge you. Sixty-five percent of Canadian exporters plan to enter one within two years. The precedent is not encouraging: when the 2018 steel and aluminum tariffs landed, Statistics Canada found that exports of the same products to other countries fell as well. Other markets did not absorb the lost volume on their own.
Four seats go to suppliers the group has dealt with before
One seat is open to a supplier they have to find
Four of the five slots go to suppliers the group has already worked with.
6sense, 2025 B2B Buyer Experience Report, 4,510 business buyers across North America, EMEA and Asia-Pacific.
How AI search will impact who gets the 5th consideration slot.
Buyers now run part of their research through AI. Forrester surveyed nearly 18,000 business buyers and found 94% use it somewhere in the buying process. The research on technical buyers specifically is narrower, and more useful: AI shapes who gets considered, not who wins the work.
- Three quarters of technical buyers notice the AI summary at the top of a search result. Of those, 69% read it and then carry on to the results underneath it.
- Only 6% treat the AI summary as enough on its own.
- Asked how far they trust what AI answers tell them, technical buyers score it 4.7 out of 10, up from 4.4 a year earlier.
- In 6sense's data, buyers used large language models mainly to summarise reviews and organise their research, not to pick a supplier.
Appearing in AI answers is what earns a place on the list. Your website and your technical documentation decide what happens after that.
Forrester Buyers' Journey Survey, January 2026. TREW Marketing and GlobalSpec, 2026 State of Marketing to Engineers, 1,100+ engineers, March 2026. 6sense, 2025 B2B Buyer Experience Report.
Tariff Response Playbook
Digital Presence Manual for Manufacturers
Available now
Everything you can do about this, channel by channel, written for a plant with no marketing department.
- Which channels to turn on first, and what each one produces in the first 90 days
- What to publish for a buyer evaluating you from a province or a country you have never sold into
- How to tell whether you are appearing at all, and what to measure instead of traffic
Three Canadian builders that got ahead of tariffs
The figures below measure output and reach, recorded in Glowtify.
- Case 01
Manufacturing
Canadian steel manufacturer
How this steel manufacturer created an ironclad digital presence
- Case 02
Marine
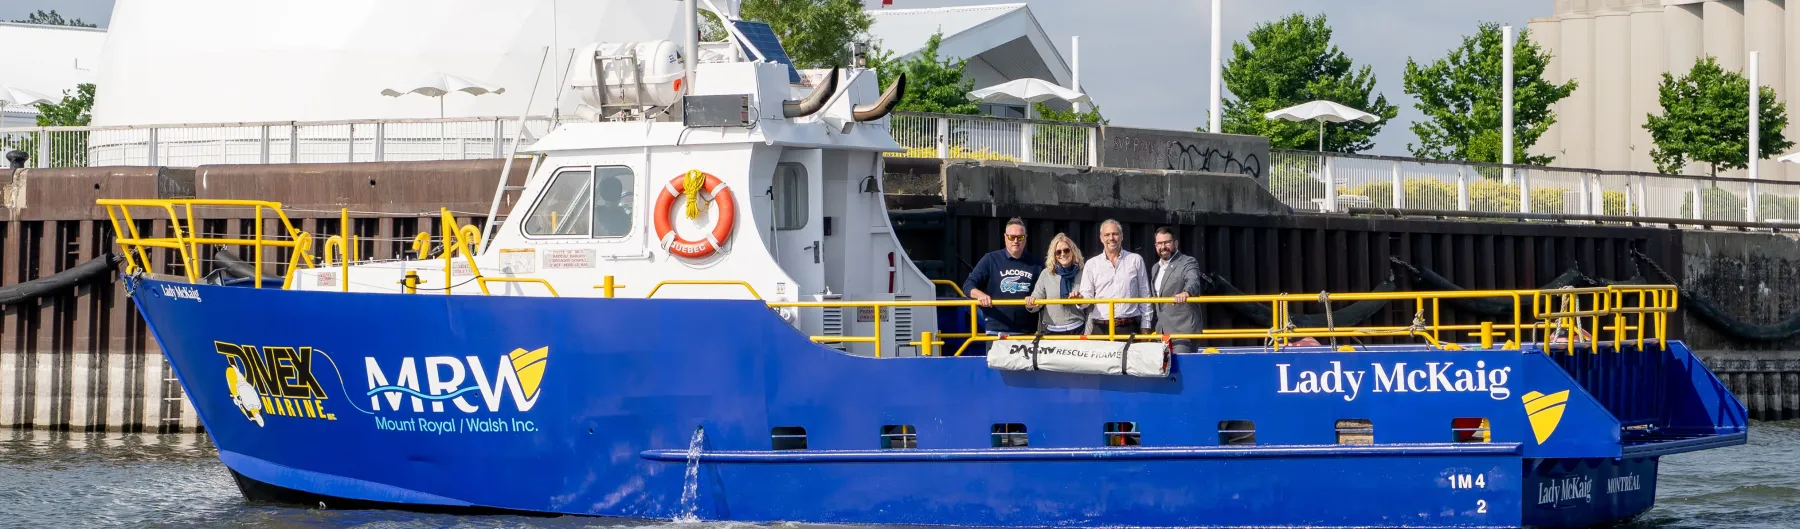
MRW Group
MRW Group: building a presence that matches their legacy
- Case 03
Manufacturing
B45 Baseball
A content engine that helps B45 win all year


Start now, while the order book still looks fine
Glowtify is waiving paid media management fees for Canadian and Quebec-based businesses that need to reach new markets. Reach out now to get the offer.
We will show you what buyers in your target market currently find when they search for what you make. It takes about twenty minutes and you keep the findings whether or not you work with us.
No deck. One call. Bilingual.
Sources
Every figure on this page traces to a named source with a date. Where a published number has since been revised, the current vintage is used and the revision is named.
Where does the tariff list come from?
The three proclamations of July 20, 2026 publish their product lists as scanned annexes, which are not machine readable. Running OCR on them was rejected, because a mis-read digit gives a wrong answer about a 50% duty. The dataset is built from the same lists after they were incorporated into the Harmonized Tariff Schedule. That text sits at U.S. Note 51 to Subchapter III of Chapter 99, which the USITC publishes in structured form. The parse produces 439 Motor Vehicles classifications, matching Holland & Knight's independent count of the annex. Alcoholic beverages account for 63 and dairy for 52, for 554 in total.
How current is it?
The list is rebuilt weekly from the USITC tariff schedule. The build script asserts the expected code counts and refuses to write a file it does not trust. This page was built from the rebuild of August 25, 2026. CBP can change scope by notice in the Federal Register without a new proclamation, so a lookup is a starting point and your customs broker is the authority.
Where do the order figures come from?
Statistics Canada, Table 16-10-0047, unfilled orders, seasonally adjusted, monthly from January 2023 to June 2026, 42 observations. The chart indexes each series to January 2023 = 100 so four series of very different sizes can be read on one axis. Total unfilled orders in June 2026 were $131.78 billion.
Why does the fabricated metal number differ from the one in the news?
The April 2026 release reported fabricated metal unfilled orders down 3.5% month over month. Statistics Canada has revised the series since. The current vintage is down 1.8% seasonally adjusted, or down 2.4% unadjusted. This page cites the current vintage. The revision does not change the direction of the finding.
Where does the wood table come from?
Statistics Canada, other wood product manufacturing, unadjusted, comparing Q1 2025 with Q1 2026: shipments $2.77B to $2.48B, new orders $2.86B to $2.51B, unfilled orders $1.31B to $1.23B. Trade coverage of the same period reported roughly minus 11, minus 13 and minus 5 percent. These figures are re-derived from Statistics Canada directly so the source is first-party.
What about the Quebec funding claim?
Investissement Québec's PSCE program is non-repayable to a maximum of $60,000 per company per year. Its eligible activity list includes developing a digital marketing strategy for foreign markets. The caps matter. Advertising, social media, newsletters and search visibility are capped at $10,000 of eligible expenses per project. The aid rate is 50% on a first project. The project itself must total at least $50,000 in eligible expenses. The 2026 intake for Europe ran June 15 to 29 and has closed. The autumn 2026 intake, September 17 to October 1, covers Latin America, Asia-Pacific, the Middle East and Oceania. The next Europe intake is spring 2027, not yet dated. Verified against the Investissement Québec program page in August 2026.
Tariff list last rebuilt August 25, 2026. Effective date of the duties: August 22, 2026.